Given the apparent leftward tilt of the state’s electorate — almost twice as many respondents identified as Democrats (41%) as did Republicans (21%) — it’s little surprise that Trump administration policies did not fare well, even as the respondents reported a relatively rosy outlook on the economy.
It hasn’t always been this way. The statewide Democratic majorities are the product of a party realignment that has taken place over the last generation. In fact, nearly one in four Washington voters was not yet born the last time we had a Republican governor or U.S. senator.
As recently as 2000, Washington was considered a swing state that prided itself on its independent voters. Until the mid-’60s, the state’s voters voted for one party for Congress and the other party for president as often as not. From 1980 to 1990 Republicans won 58% of the races for statewide office. Since 1992, Democrats have won 77% of those races.
The state’s electorate has been more evenly divided than those marquee races suggest. Legislative races paint a more detailed picture because they are not dominated by the state’s population centers and thus allow for local differences. But even these races are trending in the same direction. From 1992 through 2002, the average split between the total vote for Republican and Democratic candidates for the state House of Representatives was 1% (50% Democratic; 49 % Republican). Since 2004, the average is a 10-point advantage for the Democrats (54% to 44%). In the last two elections, the Democratic advantage has averaged 16 points (57% to 41%).
Party identification, which underlies voting patterns, is more fluid here than in other states because, unlike in most states, Washington voters do not register by party. Unless they vote in a presidential primary, the only time Washington voters have to declare a party identification is when we pollsters call them up and ask. The Elway Poll has been doing just that every month since 1992 (that changed to quarterly in 2014). The swings in party identification illuminate the state’s recent political history.
Party identification, as represented in our polling, was relatively stable and balanced throughout the ’90s, with Democrats maintaining a 3- to 5-point advantage. From 1992 to 1999, Democratic identification fluctuated between 26% and 32%, while Republicans were between 29% and 31% and Independents at 37% to 42%.
The general pattern has been for independents to outnumber Democrats in non-presidential election years. That reverses in election years, when Democrats outnumber Independents. The percentage of Republicans has remained consistently in the mid-20s.
The exception was the “Gingrich Revolution” of 1994, when Washington flipped its congressional delegation from an 8-to-1 Democratic advantage to 7-to-2 in favor of Republicans. It was the largest proportional shift of any state in the country — tossing out Speaker of the House Tom Foley in the process. Indicative of the closeness of the parties, that congressional flip resulted from a total of only 27,000 more Republican than Democratic votes statewide. By 1998, Democrats had regained a 5-4 majority of the congressional delegation.
The partisan shift accelerated in George W. Bush’s second term. The Bush administration was very good for the Democratic Party in Washington state. Heading into the 2000 election, the parties were closer than ever and Republicans had a 1-point advantage (31% to 30% Democrats, with 39% independents).
By the end of Bush’s first term (2004) the Democratic advantage was around 8 points. At the end of his second term, the gap was 14 points in favor of the Democrats. The growing gap was driven both by declining Republican identification and increases in the number of Democrats. By 2008, Republican identification had dropped 5 points to 24% while Democrats had increased 5 points to 38%.
That advantage held during the first two years of the Obama administration (12%) fluctuated in the middle, then rallied to 13 points for Obama’s last two years.
That gap shrank down to 7 points in the first year of the Trump administration but has climbed back to 13 points in the last year, including 20 points in the current poll, with Republican identification at 21%.
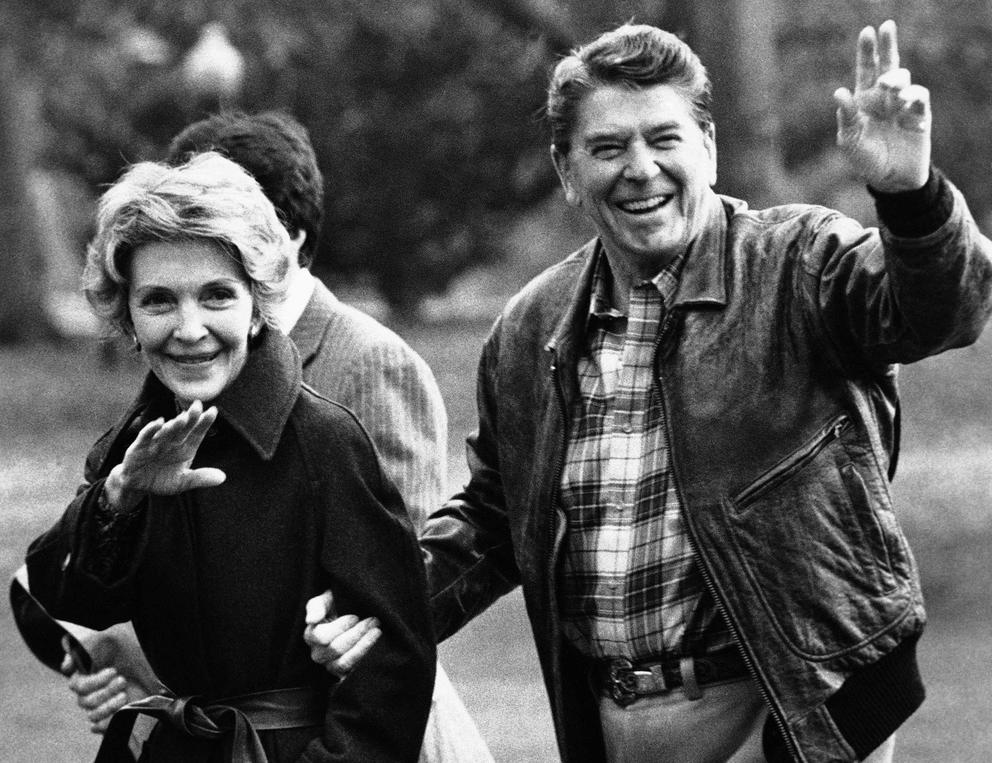
The “blueing” of Washington appears to be a combination of the rightward tack of the GOP and the changing demographics of the state. The Republican Party moved to the right during the Reagan administration. Then, in 1988, the state Republican Party sent a delegation to the GOP convention that favored TV evangelist Pat Robertson over Reagan’s vice president, George H.W. Bush. That November, after voting Republican in four straight presidential elections, Washington voted for Democrat Michael Dukakis. A Republican presidential candidate has not won the state since.
The national political scene has not helped local Republicans. The shift that began during the Reagan presidency and grew under Bush II appears to be accelerating in the Trump era.
Meanwhile, Washington has added more than 1 million voters since 2000. One in five registered voters in 2019 was not eligible to vote in 2008. Most of these new voters are in the central Puget Sound region, where 54% of the state’s voters reside and where the state Democratic majorities come from.
The national Democratic Party is veering left as the Republicans under Trump are taking a harder line on the right. The question in Washington, as elsewhere, is how far to the left can the Democrats go before losing their advantage? That question is difficult to answer for local congressional and legislative races. Outcomes in those races likely will hinge on how much distinction voters make between the national parties and their local candidates.
But on the national stage, one thing seems to be clear: With Trump as the Republican candidate, the Democrats will be able to go pretty far to the left without losing Washington state.


