A version of this story was first published in Crosscut's election newsletter. Sign up now for updates leading up to the 2019 election!
With the election now two weeks behind us and just a handful of ballots left to be processed, it seems like a good time to reflect on what, exactly, just happened. In particular, what was up with that Crosscut/Elway Poll?
We have been fielding questions from some of you about the results of the race for the 8th Congressional District, as well as two statewide initiatives — I-1631 and I-1634. How, you’ve asked, do we square our poll with the election outcomes. The quick analysis: We were way off.
Between our poll, conducted Oct. 4-9, and the election, concluded on Nov. 6, there was a wide gap of 15 percentage points in the race for the 8th District — from a 10-point lead for Dino Rossi in the survey, with a 5-point margin of error, to a 5-point win for Democrat Kim Schrier.
Our numbers for those two initiatives were far off the mark as well. The polling showed a slight majority approving of I-1631, a measure that would have required businesses to pay a fee for the carbon they emit. The final tally resulted in a 13-point loss. I-1634, which would ban municipalities from taxing some food items, saw a similar swing in the other direction, bending from a big disadvantage in early October to an 11-and-a-half point win.
So what happened? Well, the first thing our pollster, Stuart Elway, will tell you is that “this is not about predicting the future.”
“Over the years I’ve watched polling get sucked into this prediction business,” Elway says now, drawing on his 30-plus years in the business. “It was never designed to be.”
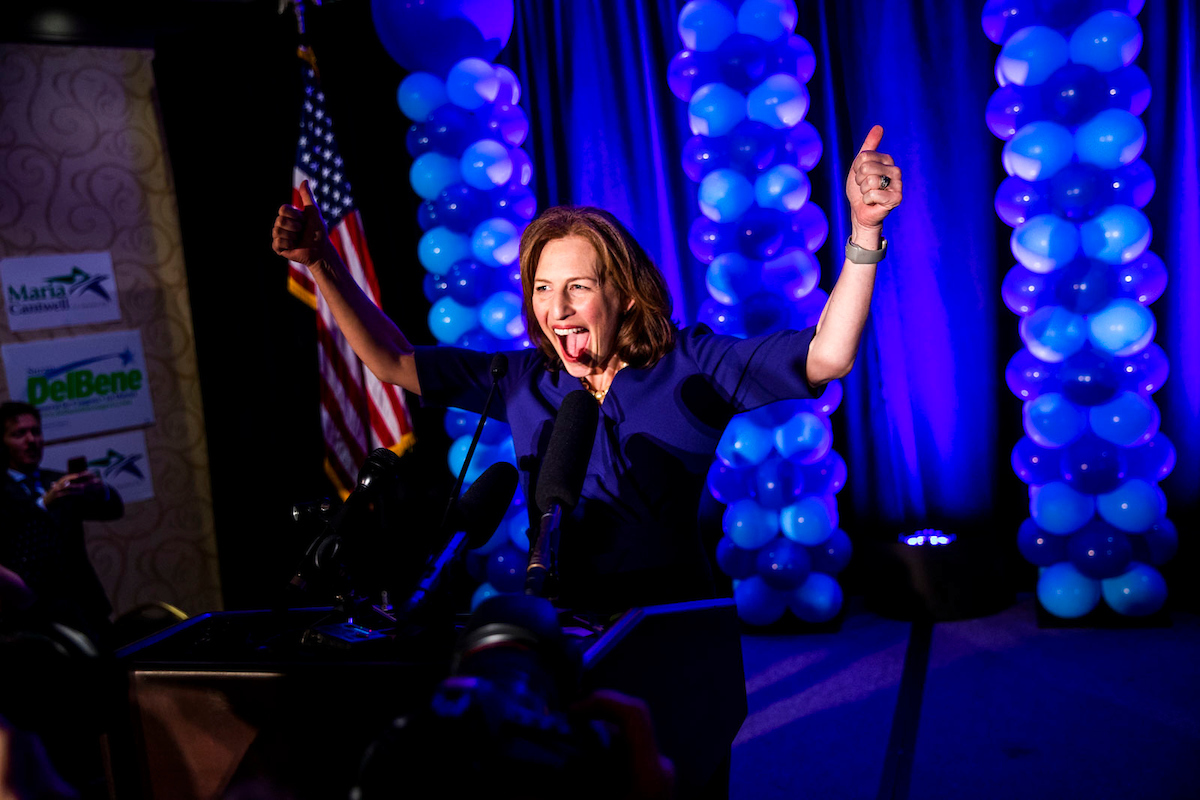
And, yet, sometimes polls can appear predictive. Those looking elsewhere in the Crosscut/Elway Poll could find results consistent with the totals on Election Day. In this year’s race for one of Washington’s U.S. Senate seats, for instance, our poll showed incumbent Democrat Maria Cantwell with an advantage over Republican Susan Hutchison, 53 to 39, with 9 percent undecided. The election result? Cantwell 58.4, Hutchison 41.6.
In our poll, 59 percent of respondents said they were likely to support I-1639, which called for greater safety measures in the sale and regulation of firearms. The measure would go on to win easily on election day, with 59 percent of the electorate voting "yes."
The dangers of looking at polls as predictors, though, are now abundantly clear. In 2016, polling conducted in advance of the presidential contest was positioned as a kind of glimpse into the near future. It wasn't. After Donald Trump’s surprise win, brutal postmortems abounded, and the American love affair with polling was all but declared dead.
But polling returned in full feather for the 2018 midterms, though with less bluster and more transparency. Of particular note was the New York Times Live Polls, which showed the actual polling in real time.
Those polls allowed readers to watch as tens of thousands of calls were placed and the willing respondents trickled in, the results of the poll fluctuating as the number of respondents slowly inched its way to 400. The point: By witnessing the laborious process of getting even 1 percent of Americans to answer their dang phones, the average reader might take the results with a grain of salt.
We were hoping to do something similar with the Crosscut/Elway Poll. While we didn’t have the resources to conduct live polling ourselves, we did set out to provide our readers with the proper context to read our polls. The partnership with Elway allowed us to release the polling results alongside stories that contextualized them — with additional reporting, as well as quotes from the pollster and respondents.
“There is an education component to it that is about how polls are done, how to read them,” Elway says.
This kind of explanatory work is difficult. In the case of the poll we conducted in the 8th, it was particularly daunting.
In late September, the New York Times had focused its live polling on the 8th and found a slight edge for Democrat Schrier — a remarkable result for a seat that has been held by Republicans since its inception. But in the days leading up to our polling dates — which were set weeks in advance — there was some indication that we might see a different result. The nation was in the grips of a highly emotional partisan battle over the pending confirmation of Judge Brett Kavanaugh to the Supreme Court and, with the balance of power in the House of Representatives up for grabs, national issues had been dominating congressional races.
Moving our dates was not an option — and neither was scrapping the poll — so we were faced with a challenge to make some sense of results emerging from what promised to be a tumultuous political landscape. To help do that, we added a question to the statewide poll. We asked how important the Supreme Court was in determining how the respondents might vote — a question that Elway almost never asks. Then the dialing began.
When Elway hand-delivered the results to us a week later, we knew we had a story. Our polling in the 8th showed a marked increase in support for the Republican candidate. It was a trend being seen elsewhere, a closing of the enthusiasm gap between Democrats and Republicans that was being called the “Kavanaugh bump.” The poll showed a 10-point lead for Rossi, but the real story was in the volatility of responses that occurred immediately following Kavanaugh’s confirmation.
In the story that accompanied the release of the data, we broke it down. Rossi enjoyed a 2-point lead among the third of respondents polled in the first two days, a 24-point lead among those polled on the Saturday when Kavanaugh was confirmed and the day following, and a 10-point lead among those polled on the following Monday and Tuesday. The margin of error for these smaller samples was larger, but the bump was undeniable. And on that question about the Supreme Court? A whopping 44 percent of statewide respondents said it was a critical issue in the election.
“The question is, did we happen to be in the field and catch this blip that will even out over time or has there been a real shift there that has fundamentally altered the race?” Elway told reporter David Kroman at the time. “We can’t know that yet.”
As the election results showed, the answer to Elway’s question was that it was, in fact, a blip — our poll was an outlier. That might make it seem like a failure. Asked about it shortly after the election, though, Elway isn't disappointed. Quite the opposite. After all, the timing of the poll provided a snapshot of Washington’s voters at a remarkable moment in American politics.
“We got that in real time,” he tells me now about the Kavanaugh drama. “Two days before the vote [on Kavanaugh, it] is an even race; during the vote it spikes for Rossi and then it settles down, and there is a month left.”
So, no, polls are not predictive. But they should have value to our readers. And like Elway, I believe that the results of the polling in the 8th do have value, that they tell a story about a critical moment in time — one that, if told properly, can give us insight into our politics.
The results of the polling on initiatives 1631 and 1634, on the other hand, I’m not so sure about.
The fact is that the drastic swings in support for these initiatives were expected. When delivering the results of the poll to the newsroom, Elway told reporters that the numbers for these measures were almost certain to change considerably before Election Day, that any initiatives floating near or below 50 percent approval (or disapproval, in the case of I-1634) were vulnerable. And it wasn’t unique to this election — he delivered a similar message to the Seattle Times in 2016.
This was the case for the carbon fee initiative (I-1631), which failed after 56 percent of voters filled in the oval next to “no” — a far cry from the 36 percent disapproval found in our polling. The ban on municipal grocery taxes (I-1634) showed the inverse, with approval jumping from a dismal 31 percent in our poll to 55 percent in the actual election.
Those are big swings.
So what happened? Elway points to the massive amounts of money spent by the campaigns seeking to influence the electorate on these initiatives. It's a compelling argument, given the disparity in spending on both measures and the fact that the final vote swung toward the big money. The winning No on 1631 campaign outspent the "yes" side by more than $14 million, while the successful Yes! to Affordable Groceries campaign outdid its opposition by $20 million to help pass I-1634.
By comparison, the forces aligned in support of the gun initiative (I-1639) outspent their opponents by just under $5 million on their way to a winning result in line with our polling.
There are likely other factors at play as well.
In our polling, there was clearly some uncertainty around both the carbon fee and the grocery tax ban — both logged significant undecided votes in the mid- to upper-teens, compared to 7 percent for the gun initiative. It makes sense. The grocery tax ban and the carbon fee are relatively complex issues, media coverage that can help decipher these measures rarely heats up until late in the election, and voter guides aren’t available until the middle of October.
Information on the initiatives does eventually find the voters, or the voters get curious and seek out the information — but until that happens, there are a lot of low-information Washingtonians out there waiting to be swayed … and polled.
In our reporting, we tried to make sense of the results. We noted in our carbon fee story that the numbers were almost certain to change. In our coverage of the grocery tax ban, we entertained the possibility that confusion could have played a role in the result. But, ultimately, there was little in the polling that could tell us what, exactly, those numbers meant.
We should accept that polling is not predictive, but what could be the value of a single poll that is expected to swing so drastically before election day? Doesn't this approach provide the same false sense of inevitability that we were all warned off of following the 2016 election? I am left thinking that there has to be a better way to address these issues in our polling and am determined to explore new approaches that will provide a more meaningful result.
There is another area where we could do better. If we expect our polls to be read as a moment in time and not a divination of election results, we need to be clearer in how we present our information.
For instance, at a time when so many readers merely scan social media for their news, we must resist the temptation to write the kind of horserace headlines that have the whiff of prediction, even if it costs us page views. Instead of “New poll shows Rossi with 10-point lead in the 8th District” (which is the headline we ran), we should be willing to embrace ambiguity: “New poll shows 8th in flux after Kavanaugh confirmation.”
We will also be working with Stuart Elway to review the methodology of our poll and to adjust it when warranted. And in future elections we will make a greater effort to put that methodology front and center in our reporting. For this election, for instance, we polled registered voters, rather than likely voters — but we didn't explain how this might impact the results. (The general gloss is that polling of registered voters favors Democrats.)
And we will be making a greater effort to encourage other journalists to read our polling results the way they are intended to be read. How we do that is yet to be determined. Whether it will work is anyone’s guess.
“When you do a poll you only get one crack at the interpretation,” Elway tells me. “Then everyone else takes and does what they want.”
Get the latest in election news
In the weeks leading up to each election (and occasionally during the legislative session), Crosscut's Election newsletter will provide you with everything you need to know about races, candidates and policy in WA state.