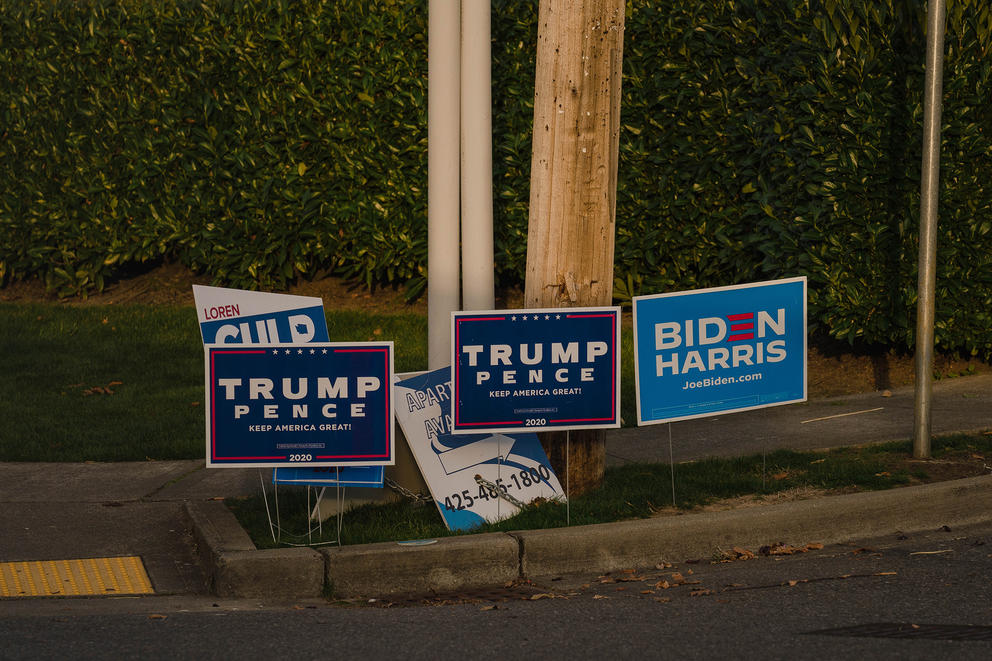
We voted for Republican Gov. Dan Evans and Democratic President Lyndon Johnson in the same election. We voted for Ronald Reagan, a Republican, in one election then Democrat Michael Dukakis in the next. But those days are disappearing in the rear-view mirror. Washington voters, like voters across the country, are now sorting themselves by gender, class, ideology and geography, and those divisions are manifesting in party identification.
Washington doesn’t have party registration, so party identification can be more fluid here than in many other states. Since the first Elway Poll in 1992, party identification has waxed and waned. Democratic identification has been as high as 46% and as low as 24%; the Republican high-water mark is 41% with a low of 18%; and Independents have fluctuated between 50% and 22%.
This fluctuation has had a trajectory, though. The gap between the parties has grown from a 5-point Democrat advantage before 2000 to a 15-point advantage in 2020, reflecting Washington’s evolution from a battleground to a deep blue state. The gap opened up in George W. Bush’s second term, then widened through the Obama and Trump presidencies.
To understand what, exactly, partisanship in Washington looks like now, I compiled a profile of today’s Washington’s Republicans, Democrats and independents. To do so, I combined the results from all four of the 2020 Crosscut/Elway polls, resulting in a representative sample of 1,628 Washington registered voters. Of these, 40% said they would register as Democrats if party registration were required, 24% as Republicans and 36% as independents. So, who are these partisans?
- 71% of the Republicans were over age 50, compared with 60% of Democrats. Put the other way, 40% of Democrats were under age 50, compared with 29% of Republicans.
- 68% of the Democrats had college degrees, compared with 57% of the Republicans;
28% of the Democrats had graduate degrees, compared with 12% of Republicans. - 63% of the Democrats were women;
57% of Republicans were men. - There was no difference by income bracket.
- 69% of the Democrats lived in urban areas (34%) or suburbs (35%); 56% of Republicans lived in small towns (33%) or rural areas (23%).
- 41% of all the Democrats in the state live in King County; 51% of the Republicans live outside of the Puget Sound corridor, from Pierce to Whatcom counties, including 30% in Eastern Washington and 21% along the coast.
As stark as some of those demographic differences are, the thinking about issues and the state of affairs is even more divided. Consider these findings from our most recent survey of 408 state voters:
- The Voter Outlook Index measures voter expectations for the country, the state, their community and their household. About 80% of Democrats said things would be better in all four areas, while 66% to 86% of Republicans said things would be worse in the country, state and their community. With regard to their own household, only 50% of Republicans said things would be worse in the years ahead.
- When asked what they thought was the most important issue the Legislature should focus on this session, 67% of Democrats cited something related to the pandemic, while only 36% of Republican did so. Partisans of both stripes named the economy second (34% of Democrats, 29% of Republican), but that was the only issue in which Republicans and Democrats were within shouting distance of each other.
- Four specific legislative issues — banning police chokeholds, making it easier to decertify problem officers, requiring the reduction of carbon emissions and a cap-and-trade plan — each had strong support from Democrats (75% to 90%) and opposition from a majority of Republicans (91% in the case of cap and trade).
- Three tax proposals — capital gains, large salary payroll and health premium — were each supported by at least 60% of Democrats and opposed by at about 80% or more of Republicans.
- 94% of Republicans said it is time to open up the economy, while 78% of Democrats said we should keep the pandemic restrictions in place “until the scientists say it is safe.”
The differences were not just about policy, but personal behavior as well. With regard to the pandemic …
- 64% of Democrats said they “always wear a mask” while 60% of Republicans wear one only when required to do so by the place they are entering (52%) or not al all (8%).
- 59% of Democrats said they would get vaccinated as soon as possible, while 75% of Republicans would definitely not get vaccinated (37%) or would “wait and see” (38%).
- Finally, 61% of Republicans had no confidence that their 2020 ballot was counted fairly and accurately (29%) or had doubts about it (32%). This in a state that has voted by mail for 15 years and whose elections have been administered by Republican secretaries of state since 1964. Among Democrats, 98% were “very” (88%) or “reasonably confident” (10%) in the integrity of their ballot.
These are not small differences on a few thorny issues. The partisans are increasingly dug in and far apart. But, as noted, the parties are not equal in strength. The long-term trend has been growing strength for the Democratic Party. Since neither party has a majority among voters, independents still hold the balance of power. Self-identified independents were between the Democrat and Republican position on nearly every issue listed here. And it is important to note that not all partisans agreed with the majority in their own party. So there is still room to maneuver and reach agreements. But as the partisans separate along demographic, cultural, geographic and ideological lines, the middle ground, which is where “politics” happens, continues to erode.


