The Voter Outlook Index asks a representative sample of respondents throughout the state of Washington whether they expect things to get better or worse over the next few years for the country, the state, their community and their household. The results are combined into a single score with a range of +8 to –8. This month’s index score is 0.11, nearly a full point below the reading in December.
The trend in voter optimism has been downward since a peak in 2014 (1.94), the index having lost nearly two points (1.83) in the past six years. So we were not in a good mood even before COVID-19 arrived. Still, it’s somewhat surprising is that the index didn’t drop further, given the pandemic.
Voter outlook differed by region: It was highest in Eastern Washington (0.51), while it was the lowest it has ever been (–0.49) in the north Puget Sound counties (Snohomish to Whatcom), and the lowest it has been in King County since 1993 (–0.08).
Unsurprisingly, there were also differences by party identification. Generally speaking, while far from declaring morning in America, Republicans were more optimistic than Democrats. Republicans’ overall index score was +0.53 to the Democrats’ –0.9.
Looking at the “net scores” — the percentage who said “better” minus the percentage who said “worse” — Republicans scored were higher than Democrats’ for the country (+23% vs. –31%); for their community (+19% vs, +4%) and for their own households (+38% vs. +26%). Republicans were less optimistic about the state (–16%), although Democrats were evenly split (47% said “better”; 47% said “worse”).
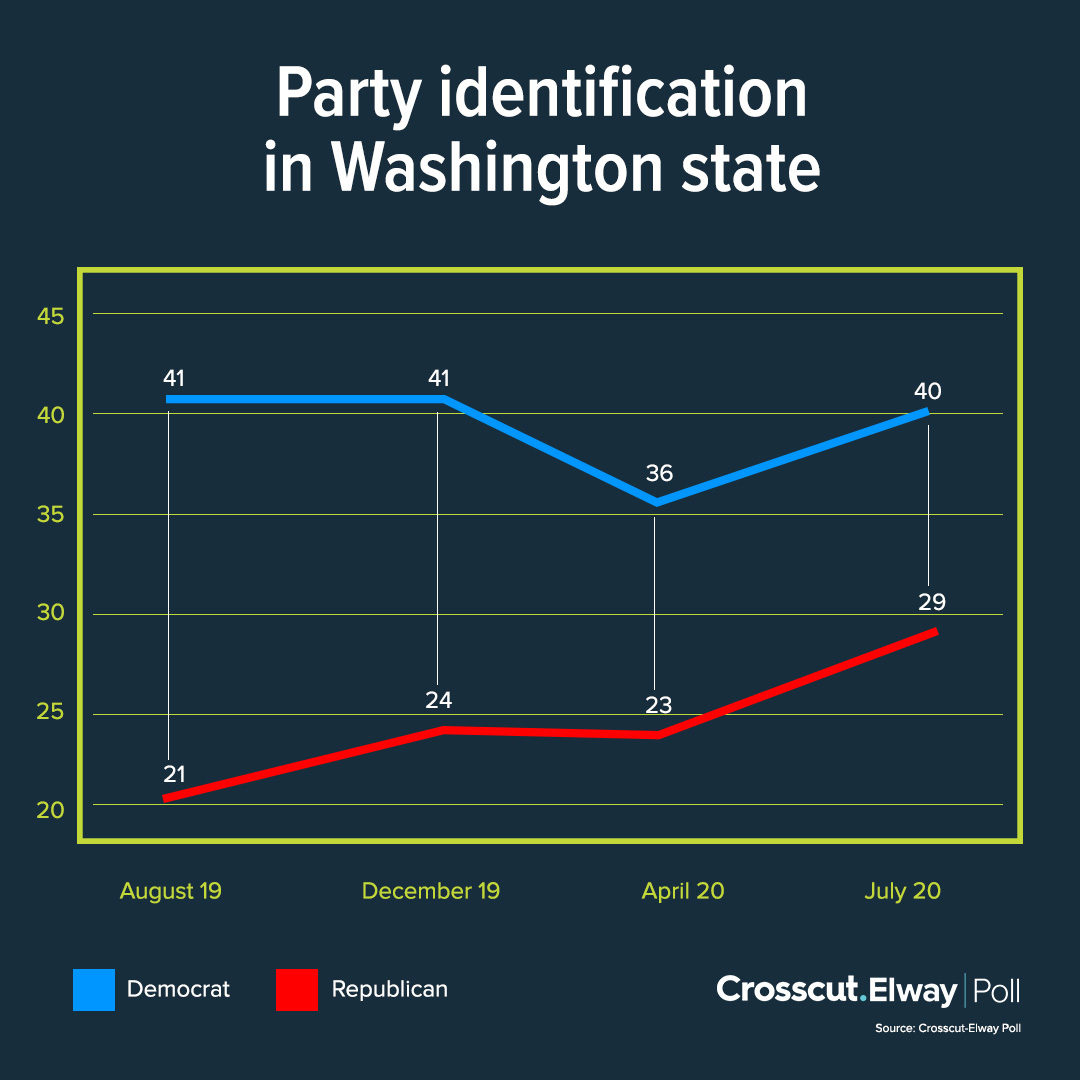
Coinciding with this decline in overall voter optimism has been an increase — more like a rebalancing — of Republican Party identification over the past year. We don’t register by party in Washington so party identification is more like an attitude than a fixed characteristic. It provides an indicator of where a voter’s default political position is.

Since 1992, we have regularly asked voters how they would register if they did have to register by party. Democrats have registered as high as 46% and as low as 24%; Republicans have ranged from 41% to 18%.
A year ago, party identification was at 41% Democrats and 21% Republicans — the widest gap in the 28 years of this poll. Since then, the gap has narrowed in three subsequent polls to 11 points, which is just above the 10-year average of 10 points. The gap was narrowed by Republican identification gaining 8 points while Democrats lost 1 point. The 29% who identified as Republicans in this poll is the highest percentage since February 2012.
The question is, why has Republican identification increased and why are those who identify as Republicans generally more optimistic than the Democrats? Don’t they know a “Blue Tsunami” is supposed to be coming to wash them away? These data don’t suggest answers, but they pose a fascinating question. We’ll be watching.


